Freya 2.x In Action
Freya is built to handle everything from quick, fact-based questions to complex, multi-layered regulatory inquiries that require deeper contextual interpretation. With the enhanced capabilities introduced in Freya 2.x, you can now explore regulations more efficiently and extract insights faster than ever.
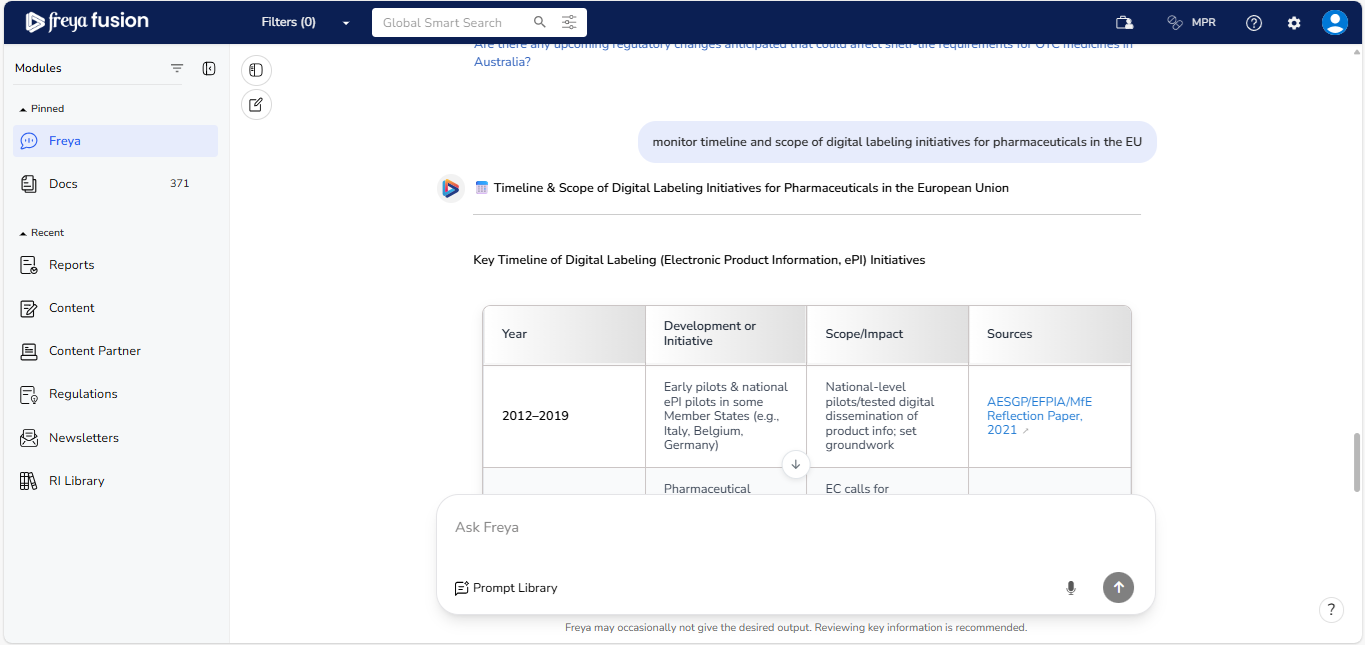
Example Query: “ Monitor timeline and scope of digital labelling initiatives for pharmaceuticals in the EU ”
In response, Freya provides a year-by-year timeline along with a breakdown of the initiative’s scope, combining trend analysis, legislative context, and structured outputs to make complex information easy to understand and act on.
Chronological Timeline
Freya presents a clear year-by-year timeline of key regulatory events, including:
- Launch of the EU Pharmaceutical Strategy
- Start and expansion of ePI (electronic product information) pilots
- Publication of legislative proposals and expected adoption pathways
Standardisation and implementation planning through 2025.
Freya’s chronological structuring helps users track policy evolution over time with clarity.
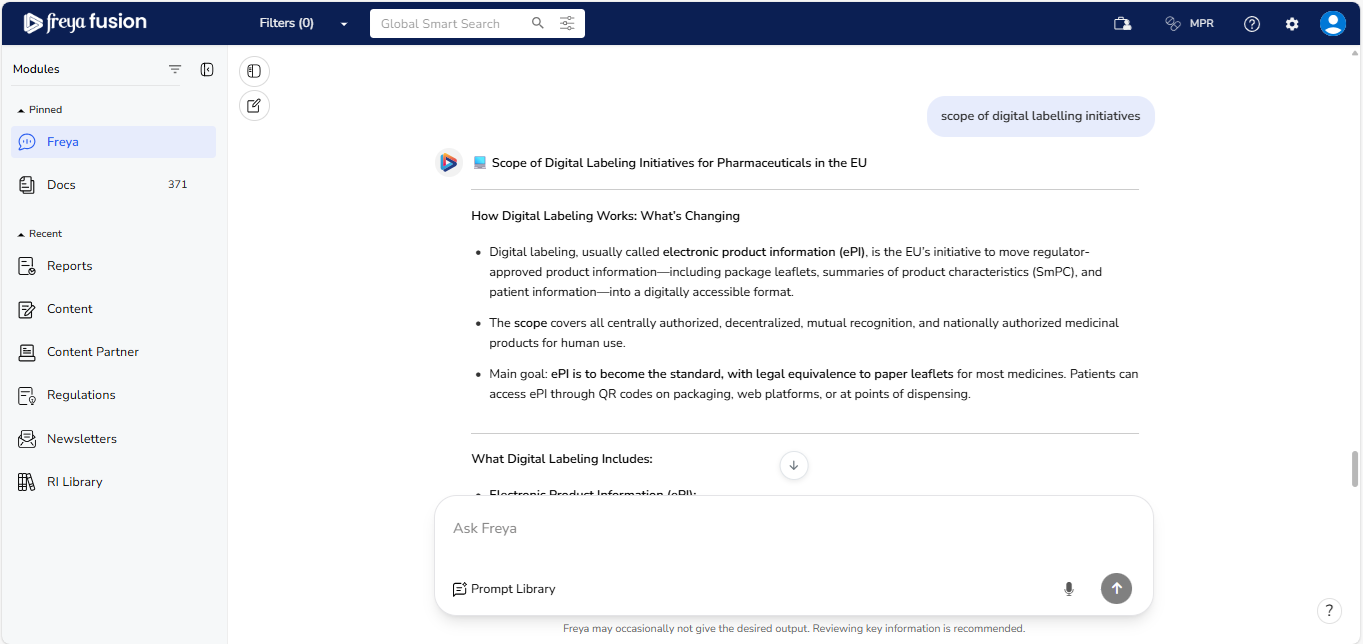
Structured Responses
Freya organizes the scope of digital labelling initiatives in EU into focused sub-sections:
- Transition to ePI: EMA-led efforts and QR-code pilots
- Regulatory Mandates: Planned legislation for system rollout
- Environmental & Patient Objectives: Alignment with the EU Green Deal
and access initiatives Freya’s structured responses break down complex policy
elements into easy-to-understand categories.
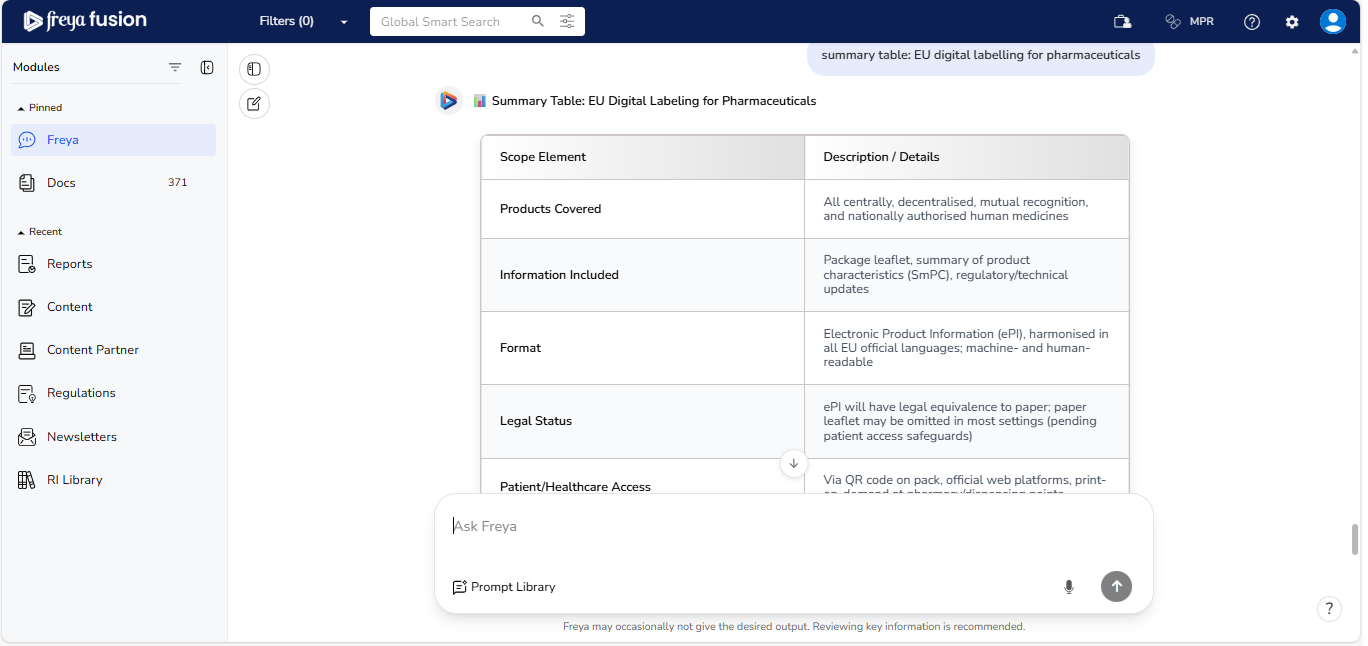
Auto-Generated Summary Tables
Freya automatically compiles a summary table showing digital labelling progress across five years — including strategy launch, pilot phases, legislative milestones, and expected adoption timelines. This helps you quickly digest timelines and share structured insights with cross-functional teams.
Reference-Based Insights with Relevance Ranking
Every response is backed by Freyr’s proprietary, expertly curated regulatory intelligence. Supporting documents are tagged and displayed under “View All Sources”.
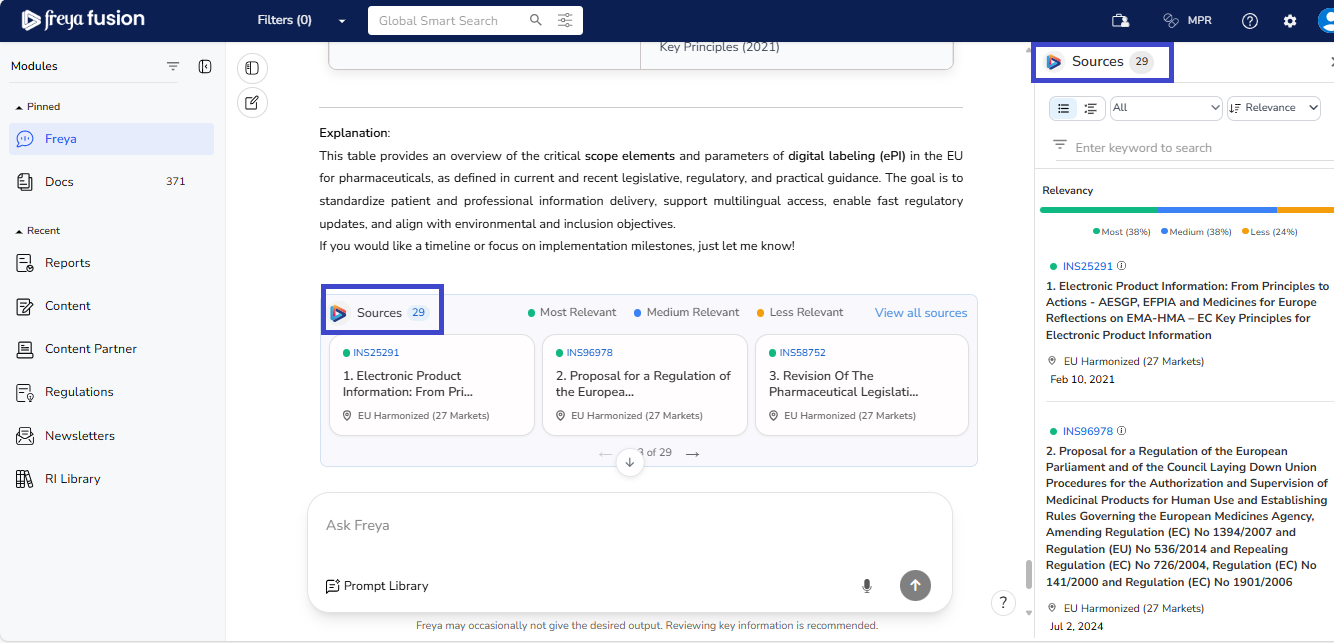
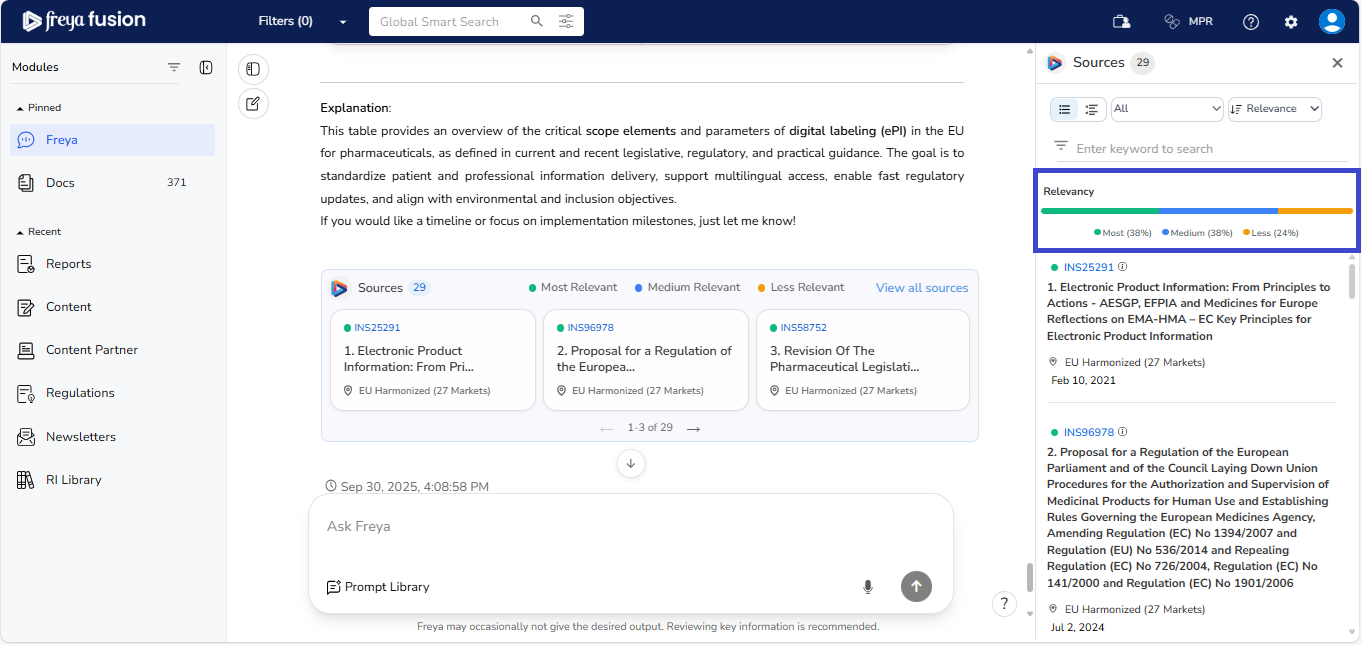
Sources are organised by relevancy; from the most directly applicable references to those providing additional context or background information. Freya’s smart reference classification allows users to prioritize and verify sources quickly.
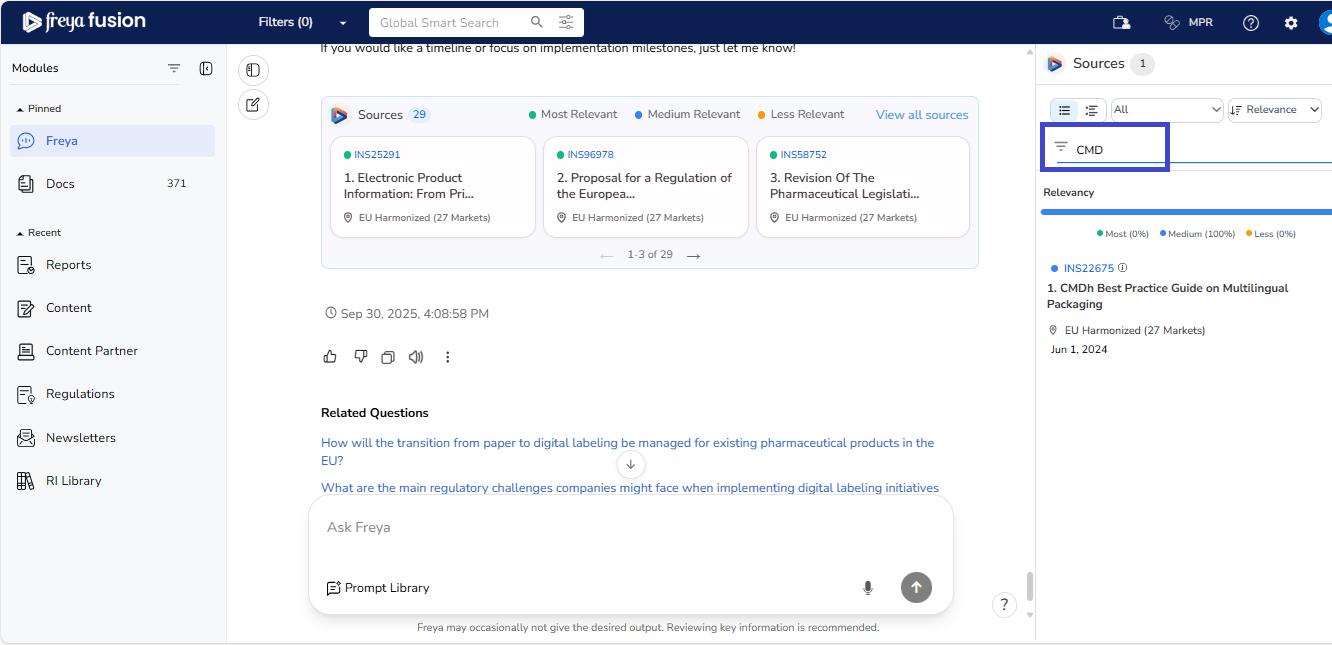
Keyword-Based Source Filtering
To narrow down source material, users can apply keyword filters (e.g., "CMDh"). This enables Freya to instantly surface relevant regulatory documents based on the selected term. This enhances precision in document validation and deep-dive analysis.
Side by Side Comparison
We follow up with a question to compare digital labelling requirements for pharmaceuticals in the EU with US.
Query: “ Compare digital labelling requirements for pharmaceuticals in the EU vs. the US ”
Freya generates a side-by-side table comparing the digital labelling requirements for pharmaceuticals in the European Union and the United States, broken down by key regulatory categories.
This layout allows you to visually scan differences across jurisdictions in a single view. This is especially useful for global regulatory planning.
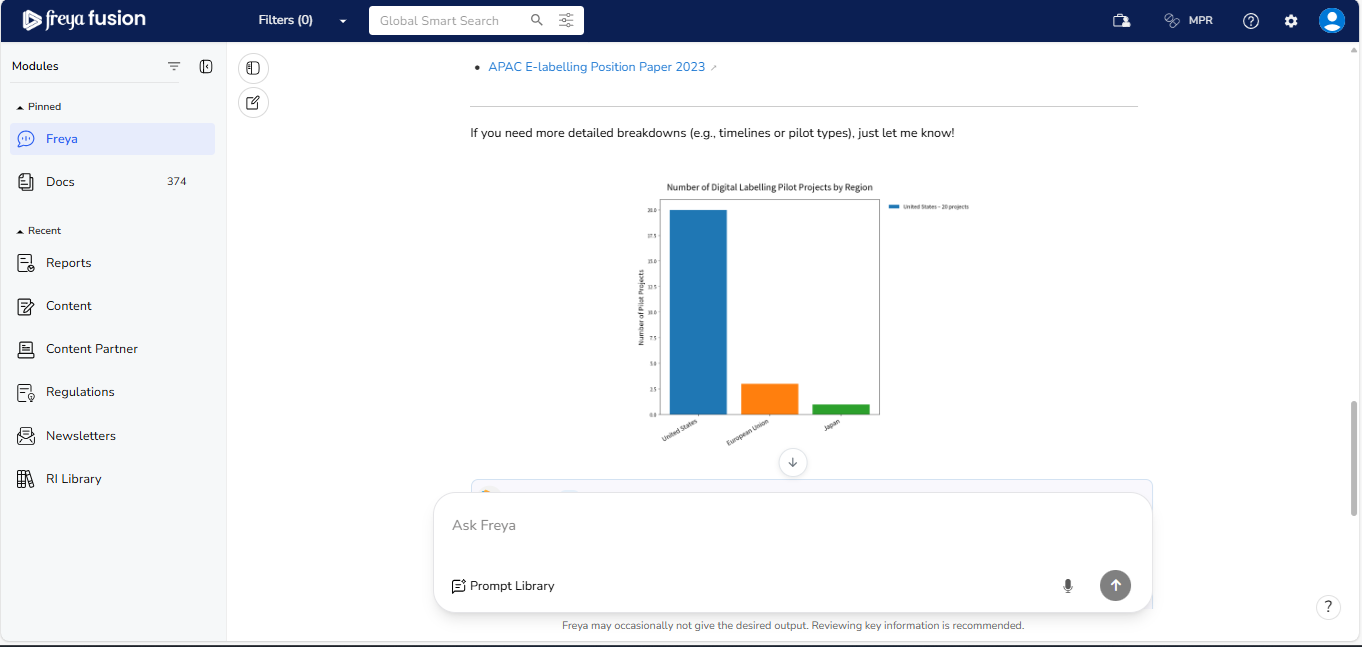
Graphs
Freya now supports graphical visualizations to make information easier to understand. Instead of only text-based responses, you can request and view your data in the form of graphs and charts. This can be illustrated by the following question.
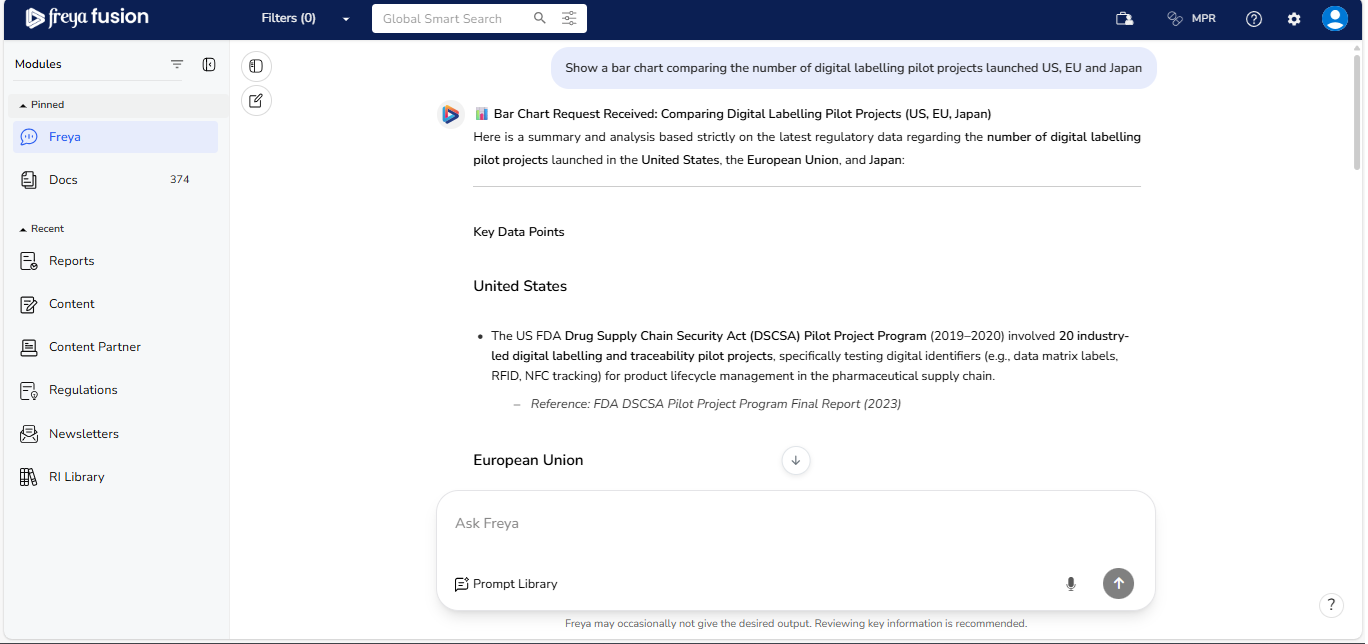
Query: "Show a bar chart comparing the number of digital labelling pilot projects launched US, EU and Japan".